In this neoload tutorial you will learn the NeoLoad architecture and its components, Neoload mainly has three tabs, design, runtime and results tab.
Design
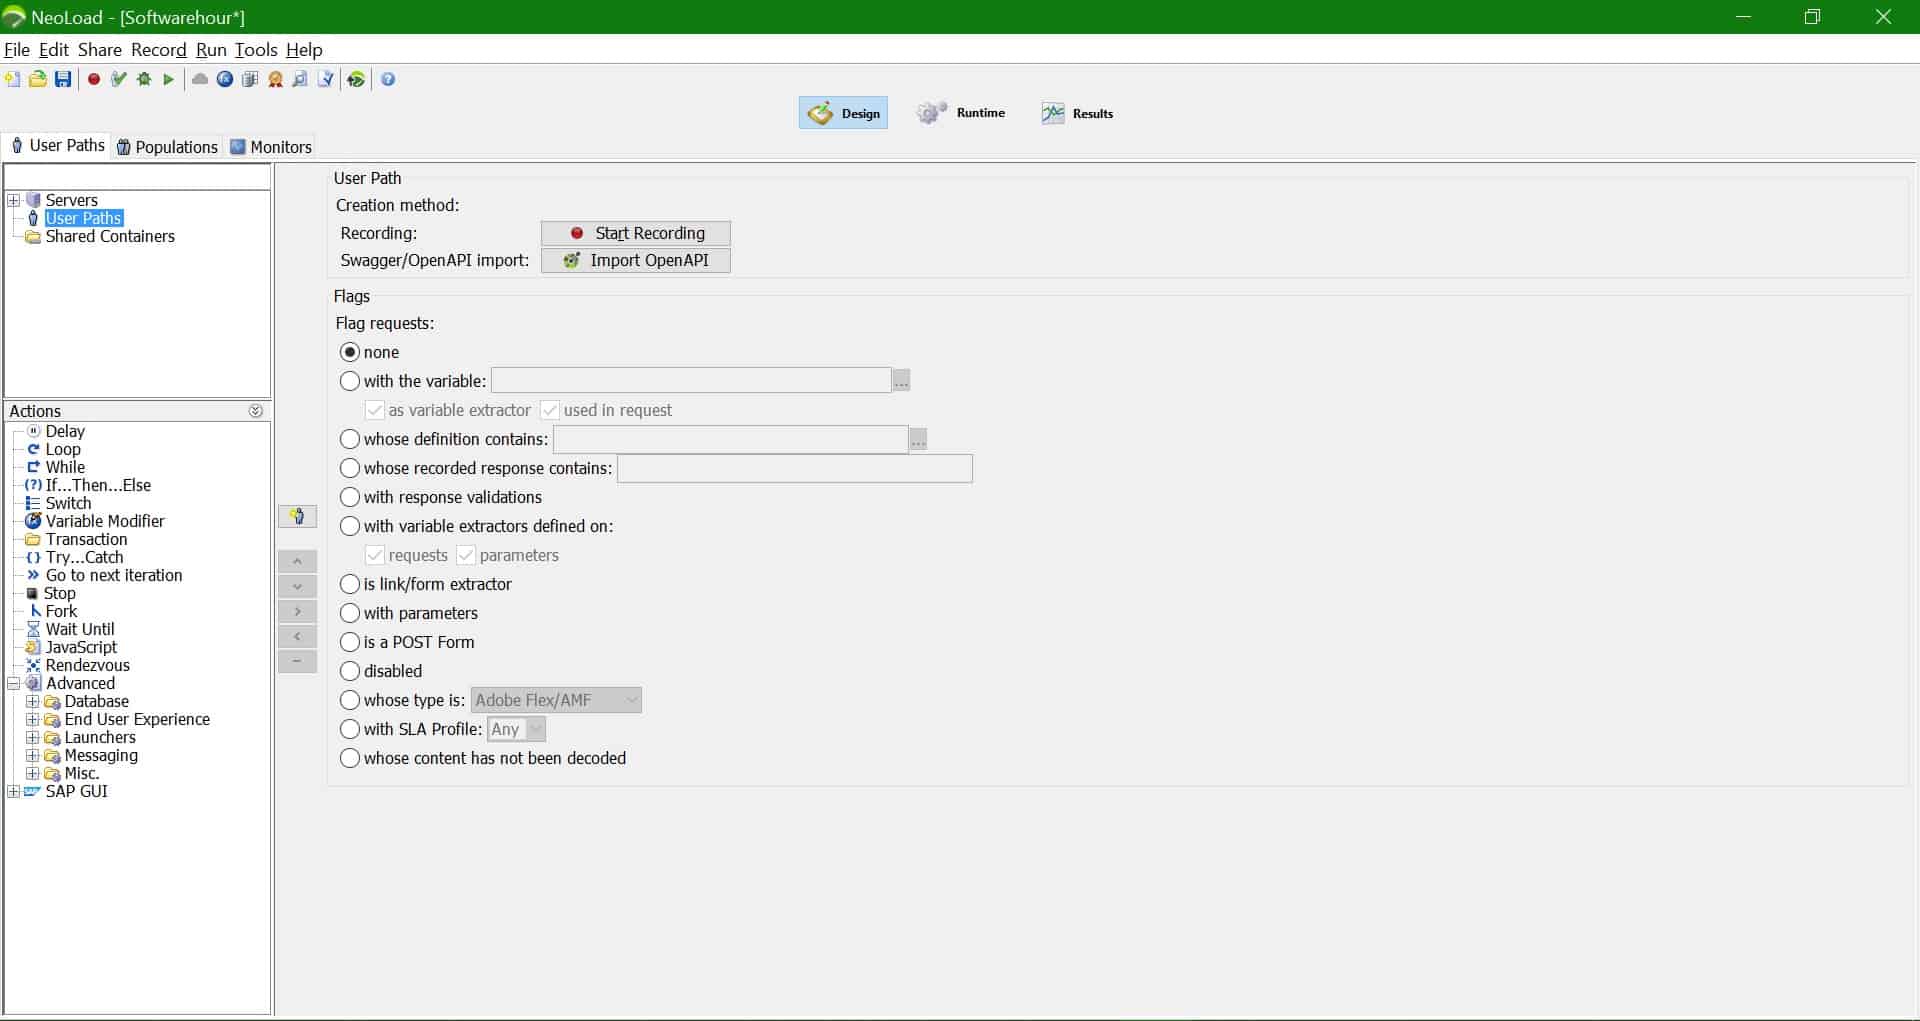
NeoLoad Design is used to record the application and setup population and configure different monitors. NeoLoad Design tab has mainly three components.
- User Paths – User path tab is used to record the application, add the transactions, parameterization, correlation, pacing, think time etc. It’s all about scripting the application.
- Population – Population is used to distribute the load between the user paths. A user path might have any number of flows. In the population you can distribute the load between user paths based on your workload model.
- Monitors – Monitors are used to add the different servers to NeoLoad and monitor the performance of the servers during the load test.

Runtime (Controller)
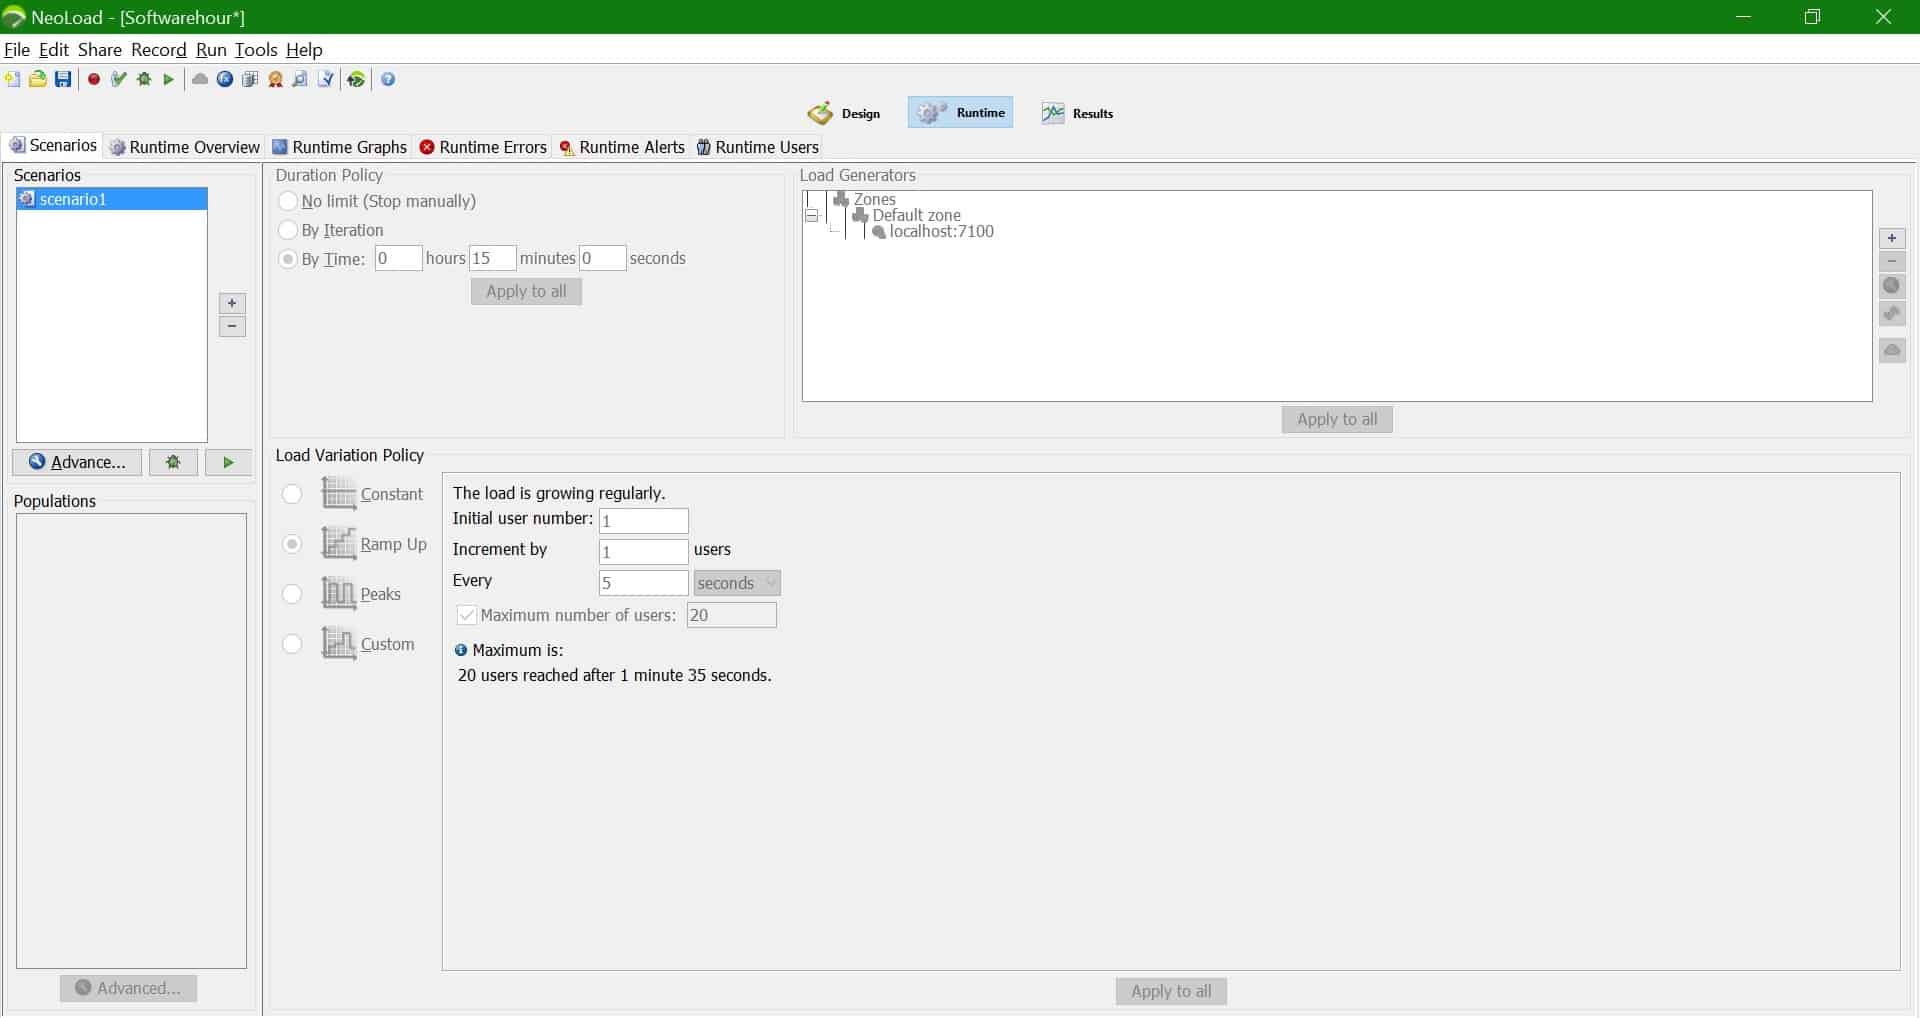
Runtime will have all the settings about how you want to run the load test, how many users’ needs to be simulated and setup the duration of the load test
- Scenraios – In Scenario tab is used to setup the virtual users, load generators, duration of the test, and ramp up period.
- RuntimeOveriew – Once the load test is started, in the runtime tab you can see different metrics like Average requests/sec, average transaction response time etc.
- Runtime Graphs – Runtime graphs is used to add different graphs during the load test to the screen and monitor the application performance.
- Runtime Errors – The name itself indicate that this tab is used to see different errors we are getting during the load test.
- Runtime Alerts – Alerts tab is used to monitor the different alerts we are getting during the load test.
- Runtime Users – In runtime tab you can monitor the current status of different users, for example what is the first user is doing, whether the user is in login page, logout page etc.
Results
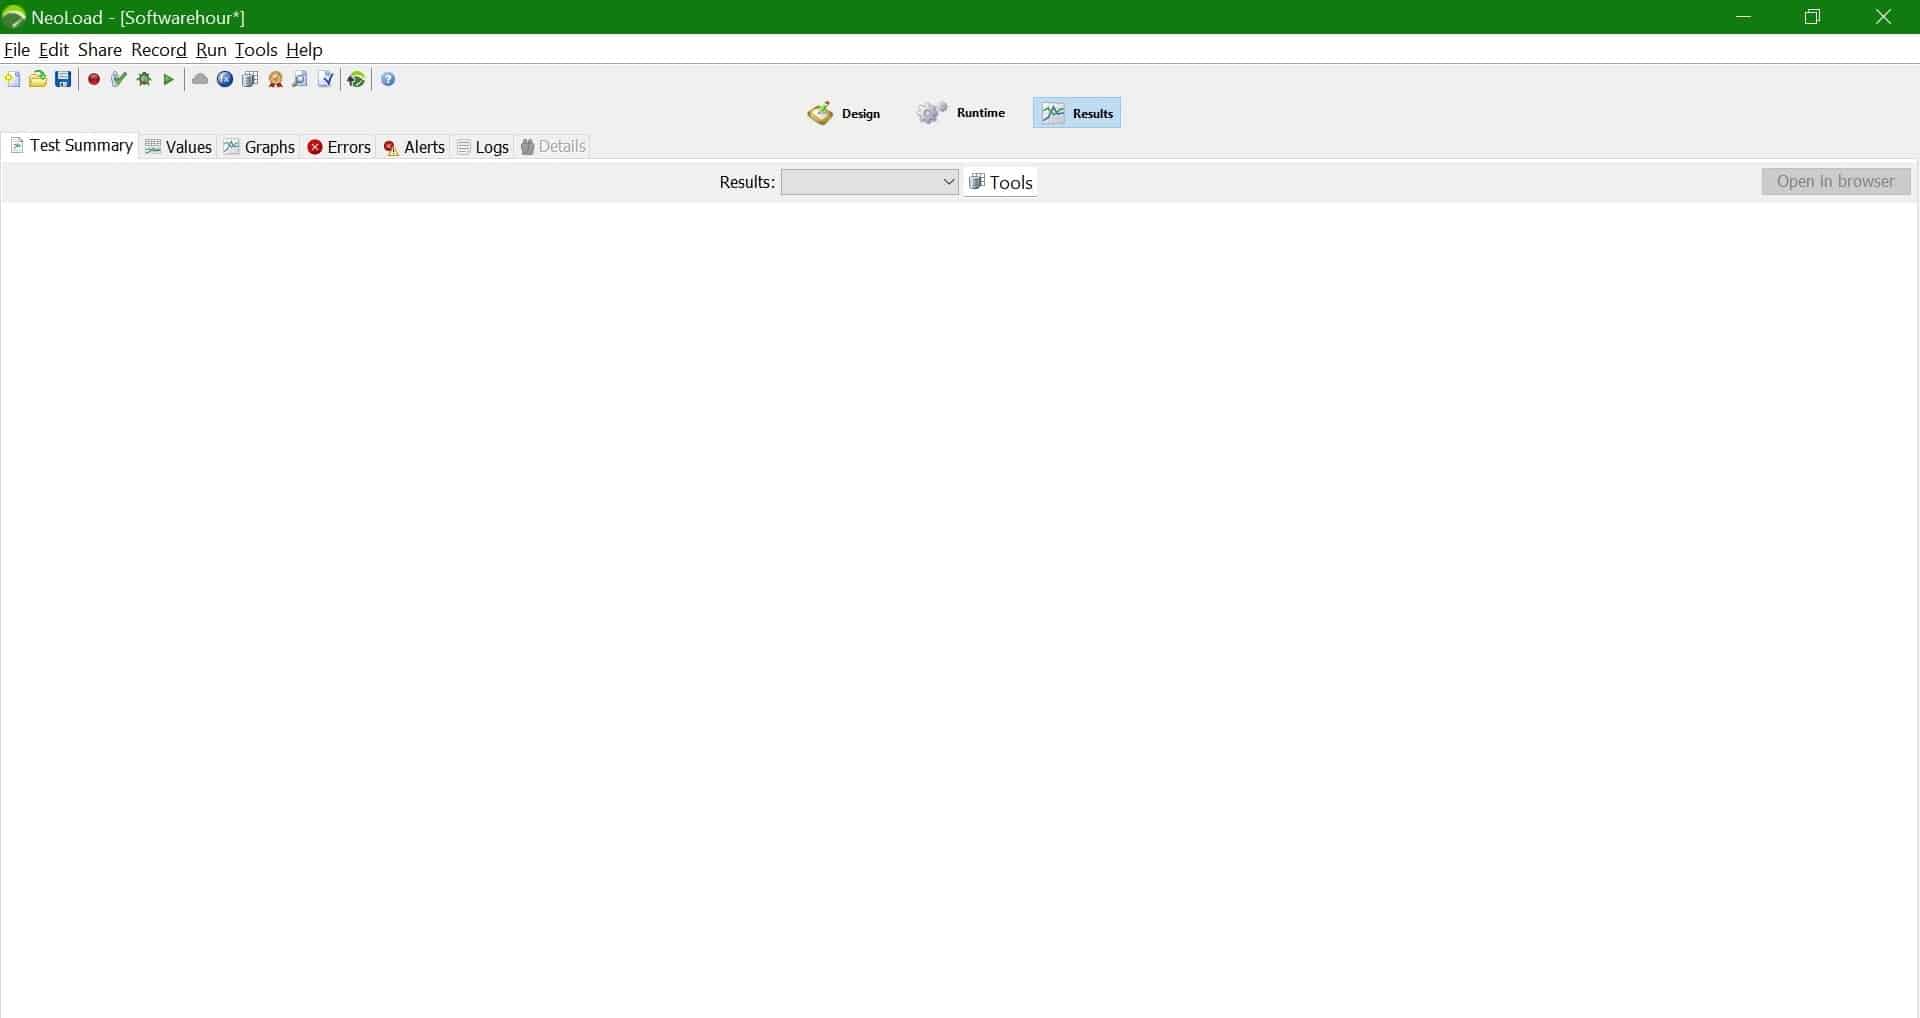
Results tab is all about the load test results and you can see different metrics like, average transaction response time, average requests per second etc. Results tab and runtime tab will have some similar tabs like, Graphs, errors.
- Test Summary – The test summary tab contains the load test results. It lists different metrics of the load test Transaction response time, SLAs, monitors, servers, user paths etc.
- Values – The value tab will list all the transaction response time of the application with minimum, average and maximum transaction response time. You will have the option to filter the metrics to see like 90th percentile transaction response time etc.
- Graphs – This tab will list all the graphs that we are selected during runtime graphs. Even this tab will list all the third party tool graphs that are integrated with the NeoLoad like Dynatrace.
- Errors – Error tab will list all the errors, you can see different errors that you got during the load test.

